INP diagnosis · Sources checked 29 July 2026
Search Console reports poor INP. Find the interaction causing it
Turn a mobile INP URL group into a reproducible developer brief. Record the real user action, slow phase, responsible script, fix, and validation evidence.
Start here
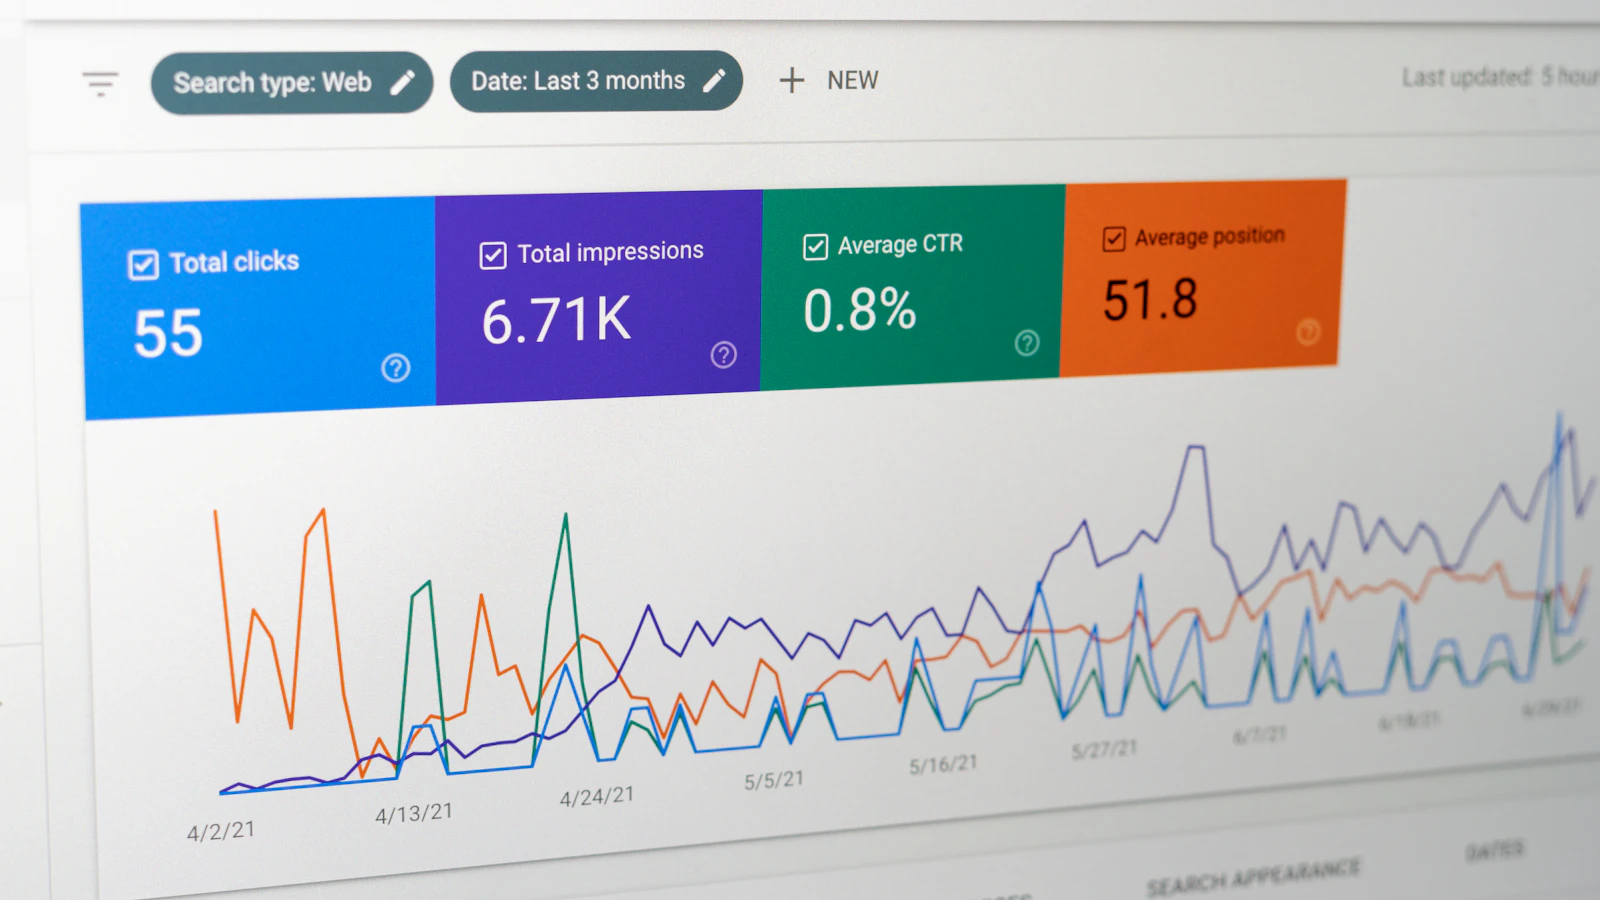
- Search Console reports INP from real Chrome visits. It groups similar URLs and reports the 75th percentile over a rolling 28-day period. A representative URL stands for a group. See Google's Core Web Vitals report guide.
- A green page-load Lighthouse run does not clear a field INP issue. That run may never perform the slow menu, filter, form, consent, chat, variation, or cart interaction.
- Reproduce likely actions on a representative template. In the Chrome Performance panel, split the slow interaction into input delay, processing duration, and presentation delay.
- Record the element, event, script, first-party or supplier responsibility, before trace, proposed change, after trace, release scope, and rollback condition.
- After release, monitor the affected template group. Search Console validation watches field data; it does not trigger reindexing or make the fix take effect.
Read the warning correctly
Search Console identifies a slow group. It does not identify the slow click.
Open the mobile or desktop report, then open the INP issue. Save the Group INP value, status, reporting date, representative URL, and other URLs in the group. Check whether those pages share a template, component, supplier script, or user action.
Search Console uses CrUX field data and groups pages with a similar experience. An example URL can perform better or worse than its group. Low-traffic pages may have no URL-level data, and Google may fall back to origin-level data. The official report documentation explains these limits.
The report establishes that real visits had a responsiveness problem. It cannot tell you which button, handler, timer, render, or embedded frame caused it. That requires an interaction trace or more detailed field attribution.
INP incident worksheet
Give the developer a case they can reproduce.
✓
**Issue:** device, Group INP, status, date observed, and Search Console issue link or screenshot.
✓
**URL group:** representative URL, example URLs, shared template, shared component, and traffic or business priority.
✓
**Likely interactions:** menu, filter, form field, consent choice, chat, product variation, add to cart, or another real action. Order them by use and consequence.
✓
**Test conditions:** device class, CPU and network setting, browser, viewport, login state, consent state, cache state, and enabled third-party tools.
✓
**Interaction trace:** target element, interaction type, total latency, input delay, processing duration, presentation delay, and trace file.
✓
**Responsible code:** first-party bundle, extension, tag-manager item, supplier widget, embedded frame, event handler, timer, or render path.
✓
**Proposed change:** the smallest change tied to the slow phase, plus the person or supplier responsible.
✓
**Proof:** same interaction before and after, adjacent actions checked, accepted result, and any remaining limit.
✓
**Release and field check:** affected templates, release date, rollback condition, field monitor, and Search Console validation date.
Three phases
The slowest phase decides where to investigate.
| Phase | What the user is waiting for | Evidence to inspect | Possible change to test |
|---|---|---|---|
| Input delay | The browser has received the action but cannot start its event callbacks | Main-thread work before the event, script loading or evaluation, timers, overlapping interactions, and third-party activity | Reduce or reschedule competing work; delay optional startup scripts; yield between tasks |
| Processing duration | Event callbacks are running | Handler call tree, synchronous calculations, repeated work, framework updates, network response parsing, and supplier callbacks | Do less in the handler; split work; cache repeated calculations; move suitable computation away from the main thread |
| Presentation delay | Callbacks finished, but the changed interface has not painted | DOM size and changes, style and layout work, rendering, observers, animation frames, and component rerenders | Reduce DOM or style work; update a smaller region; avoid layout thrashing; schedule non-visible work later |
Reproduce the problem
Trace the action that real users take.
01
Choose the template before the page
Start with the affected URL group. Pick a representative page that contains the shared menu, form, filter, product controls, or supplier script. Include a second group member to test whether the cause is shared.
02
List actions from the real visit
A load test cannot click the site for you. Record the actions people take after load, including the first menu tap, consent choice, form entry, filter, variation, chat, and cart update. Start with actions that carry traffic or revenue.

03
Record one action at a time
Use Chrome's Performance panel, start a recording, perform one action, and stop. Find it in the Interactions track. The DevTools reference shows the input, processing, and presentation timings.
04
Change one cause and repeat
Disable or change one suspected script or code path. Repeat the same action under the same conditions. Keep the change only when the trace moves and adjacent actions still work.
Common website actions
Test the action before blaming the platform.
| Action | What to capture | Where responsibility may sit |
|---|---|---|
| Mobile navigation opens | First tap after load, menu DOM update, animation, focus handling, and scripts still starting | Theme or frontend code, page builder, consent or analytics startup |
| B2B form field or step responds | Focus, validation, formatting, conditional fields, CRM or analytics listeners, and error rendering | Form extension, custom validation, tag manager, CRM embed, or application code |
| WooCommerce variation changes | Variation selection, price and stock update, gallery change, event chain, and cart fragments | Theme, WooCommerce extension, custom script, recommendation or analytics tool |
| Filter or search results update | Input event, debounce, request, response parsing, DOM replacement, and result count | Application code, search supplier, framework render, or large result DOM |
| Consent or chat opens | First tap, supplier bundle startup, iframe work, layout change, and callbacks registered by other tags | Consent platform, chat supplier, tag manager, or integration code |
| Add to cart or checkout step advances | Click handler, pricing or stock work, network response, state update, error path, and next paint | Commerce code, payment or tax integration, theme, analytics, or recommendation script |
When the lab stays fast
Use field attribution only when the missing evidence warrants it.
CrUX confirms a field problem but does not identify the interaction. Google's field diagnosis guide describes the attribution build of the web-vitals library. It can record the interaction target and type, input delay, processing duration, presentation delay, and script details from Long Animation Frames.
Adding first-party field measurement changes site data collection. Define the fields, sampling, retention, access, and deletion first. Avoid collecting typed values or personal data. Ask the privacy owner to review consent or legal-basis requirements before release.
Use field attribution for enough visits to identify a repeatable interaction and template. Then reproduce that case in the lab. A permanent stream of detailed interaction data needs a separate operating reason.
Technical next step
Get a technical read on: Diagnose an INP problem
Send your URL and the problem you are seeing. We reply with what is fixable this month and what needs a bigger scope.
Prove and release the fix
A faster trace is the first proof. Field validation is the final check.
Repeat the exact interaction with the same test conditions. Save the before and after traces. Check the neighbouring actions, mobile viewport, keyboard path, errors, analytics, and supplier integration. Google's manual diagnosis guide shows how to inspect the three phases.
Release the change to every affected template instance or explain the boundary. Monitor first-party field data if it exists. Start Search Console validation when the group-level fix is live. Google's validation help explains that validation monitors a 28-day window and does not request indexing.
Keep a rollback condition. A lower INP value does not justify a broken form, missing analytics event, inaccessible menu, or incorrect price.
Buyer questions
Answers for the supplier brief.
Why is Lighthouse green while Search Console reports poor INP?
They measure different evidence. Search Console reports real-user field data for a URL group over a rolling 28-day period. A normal Lighthouse page-load run is one lab test and may never perform the slow interaction. Reproduce the menu, form, filter, consent, chat, variation, or cart action from the affected template.
Does the example URL in Search Console cause the whole issue?
The example represents a group of similar URLs. It may be faster or slower than the group. Check the listed members and their shared template, component, and scripts. Test at least one additional group member before limiting the fix to one page.
What does an INP longer than 200 ms mean?
Google rates INP of 200 milliseconds or less as good at the 75th percentile. Between 200 and 500 milliseconds needs improvement; above 500 milliseconds is poor. The group value does not identify the action or code, so keep diagnosing before buying a generic speed fix.
Can a WordPress performance plugin fix INP?
A plugin can change caching, loading, or script execution and may help a measured cause. It can also delay required code or leave the slow handler unchanged. Capture the interaction and phase first, then test the plugin setting against that trace and the form, menu, commerce, consent, and analytics paths it affects.
How long does Search Console take to show the fix?
Search Console validation monitors a 28-day field-data window. Traffic, grouping, and remaining affected URLs influence the result. Starting validation does not reindex the pages or speed up data collection. Use lab traces and optional first-party field data for earlier evidence.
What should we send for an INP diagnosis?
Send the Search Console issue screenshot, device, Group INP, representative and example URLs, shared template, likely user actions, recent releases, tag-manager export, consent and chat tools, WordPress theme or extension list, and any existing trace or RUM data.
Performance work
Turn the warning into a fix your supplier can verify.
Some Tech Work maps the URL group, records the affected interactions, separates the three latency phases, identifies the code or supplier boundary, and writes the smallest testable fix. The handoff includes before and after traces, release scope, rollback conditions, and field checks.
Use the 2026 Core Web Vitals checklist for broad LCP, INP, and CLS work. Use the performance budget guide for release controls. For diagnosis and implementation, request a website performance review.
Written by
Vineet Talwar
Co-founder, Tech & Operations at Some Tech Work. WordCamp speaker across Europe and Asia, and host of the WP Shoutout podcast.
Start here
Ready to talk.Book a short diagnostic.
Tell us what needs fixing
We read every brief and reply within one business day.
Prefer to talk first?or request a tech stack audit →or email us directly →
Not sure where to start? Send the stuck decision, workflow, or page. We will say whether you need a diagnostic call, a tech stack audit, or a different first step.